Connecting stateful applications in multicluster environments with RHACM and Submariner
How can I deploy my applications in multiclustering environments and connect my microservices across the different clusters using the SDN and overlay networks?
This is the second blog post about Submariner and RHACM and it’s based in the Installation and configuration of Submariner within RHACM blog post. So if you didn’t check it, go ahead and take a look! :)
Overview
Now that we know Submariner and RHACM a bit more, let’s go to the Service Discovery configuration, following by deploying one simple Nginx application for testing the communication, and finally deploying a more complex stateful application using a Frontend and a Redis Master/Slave, spanned across the clusters.
Install Submariner with Service Discovery
After Submariner is deployed into the same environment as your managed clusters, the routes are configured for secure IP routing between the pod and services across the clusters in the ManagedClusterSet.
To make a service from a cluster visible and discoverable to other clusters in the ManagedClusterSet, you must create a ServiceExport object.
The ServiceExport is used to specify which Services should be exposed across all clusters in the cluster set. If multiple clusters export a Service with the same name and from the same namespace, they will be recognized as a single logical Service.
We will install the Service Broker using the subctl util that simplifies very much the installation of the Service Broker and also have a very handy tool to manage and see the status of the submariner connections, endpoints, etc.
- Install subctl tool into your system:
$ curl -Ls https://get.submariner.io | bash
$ export PATH=$PATH:~/.local/bin
$ echo export PATH=\$PATH:~/.local/bin >> ~/.profile
- Configure the cluster1 (aws-sub1) as Submariner Broker
$ oc config use-context cluster1
$ mkdir aws-sub1
$ subctl deploy-broker --kubeconfig /tmp/test/aws-sub2/aws-sub1-kubeconfig.yaml
 ✓ Deploying broker
 ✓ Creating broker-info.subm file
 ✓ A new IPsec PSK will be generated for broker-info.subm
- Join cluster1 to the Submariner Broker
$ subctl join --kubeconfig /tmp/test/aws-sub2/aws-sub2-kubeconfig.yaml broker-info.subm --clusterid aws-sub2
* There are 1 labeled nodes in the cluster:
  - ip-xx.xx.xx.xx.eu-west-1.compute.internal
⠈⠁ Discovering network details     Discovered network details:
        Network plugin:  OpenShiftSDN
        Service CIDRs:   [172.31.0.0/16]
        Cluster CIDRs:   [10.132.0.0/14]
 ✓ Discovering network details
 ✓ Validating Globalnet configurations
 ✓ Discovering multi cluster details
 ✓ Deploying the Submariner operator
 ✓ Created operator CRDs
 ✓ Created operator service account and role
 ✓ Updated the privileged SCC
 ✓ Created lighthouse service account and role
 ✓ Updated the privileged SCC
 ✓ Created Lighthouse service accounts and roles
 ✓ Deployed the operator successfully
 ✓ Creating SA for cluster
 ✓ Deploying Submariner
 ✓ Submariner is up and running
NOTE: we’re using the kubeconfigs because the subctl tool works better if you specifies them, in order to identify and use the clusters to configure into the Broker.
- Configure the cluster2 (aws-sub2) as Submariner Broker
$ subctl deploy-broker --kubeconfig /tmp/test/aws-sub2/aws-sub2-kubeconfig.yaml
 ✓ Deploying broker
 ✓ Creating broker-info.subm file
 ✓ A new IPsec PSK will be generated for broker-info.subm
- Join cluster2 to the Submariner Broker
$ subctl join --kubeconfig /tmp/test/aws-sub2/aws-sub2-kubeconfig.yaml broker-info.subm --clusterid aws-sub2
* broker-info.subm says broker is at: https://api.aws-sub2.xxxx.example.rcarrata.com:6443
* There are 1 labeled nodes in the cluster:
  - ip-xx-xx-xx-xx.eu-west-1.compute.internal
⠈⠁ Discovering network details     Discovered network details:
        Network plugin:  OpenShiftSDN
        Service CIDRs:   [172.30.0.0/16]
        Cluster CIDRs:   [10.128.0.0/14]
 ✓ Discovering network details
 ✓ Validating Globalnet configurations
 ✓ Discovering multi cluster details
 ✓ Deploying the Submariner operator
 ✓ Created operator CRDs
 ✓ Created operator service account and role
 ✓ Updated the privileged SCC
 ✓ Created lighthouse service account and role
 ✓ Updated the privileged SCC
 ✓ Created Lighthouse service accounts and roles
 ✓ Deployed the operator successfully
 ✓ Creating SA for cluster
 ✓ Deploying Submariner
 ✓ Submariner is up and running
- In the process of joining clusters to the Broker, also a submariner-operator is deployed and configured, among other elements.
$ oc get pod -n submariner-operator
NAME                                           READY   STATUS    RESTARTS   AGE
submariner-gateway-86bk9                       1/1     Running   0          19s
submariner-lighthouse-agent-58c74d7f5-8fl5t    1/1     Running   0          14s
submariner-lighthouse-coredns-985f9b4b-hpqrd   1/1     Running   0          14s
submariner-lighthouse-coredns-985f9b4b-vsbff   1/1     Running   0          14s
submariner-operator-6df7c9d659-s56vf           1/1     Running   0          55s
submariner-routeagent-26zkz                    1/1     Running   0          14s
submariner-routeagent-86wzj                    1/1     Running   0          14s
submariner-routeagent-fdz4w                    1/1     Running   0          14s
submariner-routeagent-hdfrw                    1/1     Running   0          14s
submariner-routeagent-hdt4m                    1/1     Running   0          14s
submariner-routeagent-lflw5                    1/1     Running   0          14s
submariner-routeagent-n2jx4                    1/1     Running   0          14s
Check the documentation of the Architecture of Submariner for more details about the different components used by the operator.
Checking the Submariner Details in our Managed Clusters
Subctl is a very nice tool in order to investigate more details about the status of the Endpoints, connections, and gateway details among others.
- Execute a general ‘subctl show’ to get all the details and the current status:
$ subctl show all --kubeconfig /tmp/test/aws-sub2/aws-sub2-kubeconfig.yaml

Showing information for cluster "aws-sub2":
Showing Network details
    Discovered network details:
        Network plugin:  OpenShiftSDN
        Service CIDRs:   [172.30.0.0/16]
        Cluster CIDRs:   [10.128.0.0/14]


Showing Endpoint details
CLUSTER ID                    ENDPOINT IP     PUBLIC IP       CABLE DRIVER        TYPE
aws-sub2                      10.0.31.78      xx.xx.xx.xx   libreswan           local
aws-sub1                      10.10.37.208    xx.xx.xx.xx   libreswan           remote

Showing Connection details
GATEWAY                         CLUSTER                 REMOTE IP       CABLE DRIVER        SUBNETS                                 STATUS
ip-10-10-37-208                 aws-sub1                10.10.37.208    libreswan           172.31.0.0/16, 10.132.0.0/14            connected

Showing Gateway details
NODE                            HA STATUS       SUMMARY
ip-10-0-31-78                   active          No connections are established

Showing version details
COMPONENT                       REPOSITORY                                            VERSION
submariner                      quay.io/submariner                                    0.8.1
submariner-operator             quay.io/submariner                                    0.8.1
service-discovery               quay.io/submariner                                    0.8.1
- Also we can see the Networks used by Submariner to connect the clusters:
$ subctl show networks --kubeconfig /tmp/test/aws-sub1/aws-sub1-kubeconfig.yaml

Showing network details for cluster "aws-sub1":
    Discovered network details:
        Network plugin:  OpenShiftSDN
        Service CIDRs:   [172.31.0.0/16]
        Cluster CIDRs:   [10.132.0.0/14]

subctl show networks --kubeconfig /tmp/test/aws-sub2/aws-sub2-kubeconfig.yaml

Showing network details for cluster "aws-sub2":
    Discovered network details:
        Network plugin:  OpenShiftSDN
        Service CIDRs:   [172.30.0.0/16]
        Cluster CIDRs:   [10.128.0.0/14]
As you can see it’s using the Cluster Networks and Service Netwoks. For this reason was so important to not overlap each network! Now can be communicated in a L2/L3 level!
Verify the Submariner connectivity with Service Discovery
Let’s generate our first testing to see if our service networks and cluster networks can be communicated through the Submariner IPsec tunnels.
- In cluster1 (aws-sub1) deploy a simple nginx pod and expose the service:
$ oc config use cluster1
Switched to context "cluster1"

$ oc -n default create deployment nginx --image=nginxinc/nginx-unprivileged:stable-alpine
deployment.apps/nginx created

$ oc -n default expose service nginx --port=8080
service.apps/nginx created

$ oc get pod -n default
NAME                     READY   STATUS    RESTARTS   AGE
nginx-6fdb7ffd5b-n5xhd   1/1     Running   0          15s
- Generate a ServiceExport for the nginx service:
$ cat << EOF | kubectl apply -f -
apiVersion: multicluster.x-k8s.io/v1alpha1
kind: ServiceExport
metadata:
  name: nginx
  namespace: default
EOF
serviceexport.multicluster.x-k8s.io/nginx created
Remember that the ServiceExport is used to specify which Services should be exposed across all clusters in the cluster set.
- Let’s investigate the status of our ServiceExport:
$ oc get serviceexport nginx -o jsonpath='{.status}' | jq -r .
{
  "conditions": [
    {
      "lastTransitionTime": "2021-04-10T15:10:05Z",
      "message": "Awaiting sync of the ServiceImport to the broker",
      "reason": "AwaitingSync",
      "status": "False",
      "type": "Valid"
    },
    {
      "lastTransitionTime": "2021-04-10T15:10:05Z",
      "message": "Service was successfully synced to the broker",
      "reason": "",
      "status": "True",
      "type": "Valid"
    }
  ]
}
Seems that it’s working properly! All right!
- Now switch to the cluster2 in order to test the connectivity from the cluster2 to cluster1 services deployed:
$ oc config use-context cluster2
Switched to context "cluster2".
ServiceExports must be explicitly created by the user in each cluster and within the namespace in which the underlying Service resides, in order to signify that the Service should be visible and discoverable to other clusters in the cluster set.
- Let’s test the connectivity from the second cluster test pod:
$ oc -n default run submariner-test --rm -ti --image quay.io/submariner/nettest -- /bin/bash
bash-5.0# curl nginx.default.svc.clusterset.local:8080 -I
HTTP/1.1 200 OK
Server: nginx/1.18.0
Date: Sat, 10 Apr 2021 15:17:58 GMT
Content-Type: text/html
Content-Length: 612
Last-Modified: Thu, 29 Oct 2020 15:23:06 GMT
Connection: keep-alive
ETag: "5f9ade5a-264"
Accept-Ranges: bytes
When a Service is exported, it then becomes accessible as
- To access a Service in a specific cluster (in our case cluster1 with name aws-sub1), prefix the query with clusterid as follows:
bash-5.0# curl aws-sub1.nginx.default.svc.clusterset.local:8080 -I
HTTP/1.1 200 OK
Server: nginx/1.18.0
Date: Sat, 10 Apr 2021 15:18:29 GMT
Content-Type: text/html
Content-Length: 612
Last-Modified: Thu, 29 Oct 2020 15:23:06 GMT
Connection: keep-alive
ETag: "5f9ade5a-264"
Accept-Ranges: bytes
- Let’s perform a quick test for see the latency between the curl in the aws-sub2 cluster2 to the nginx in the aws-sub1 cluster1:
bash-5.0# curl -w "dns_resolution: %{time_namelookup}, tcp_established: %{time_connect}, TTFB: %{time_starttransfer}\n"
 -o /dev/null -s aws-sub1.nginx.default.svc.clusterset.local:8080
dns_resolution: 0.004474, tcp_established: 0.007448, TTFB: 0.009060
not bad, right?
- Let’s check the ip of our submariner-test pod where we perform the curl:
bash-5.0# ip ad | grep eth0
3: eth0@if64: <BROADCAST,MULTICAST,UP,LOWER_UP,M-DOWN> mtu 8951 qdisc noqueue state UP
    inet 10.128.2.58/23 brd 10.128.3.255 scope global eth0
so the IP of our pod is 10.128.2.58 (within the aws-sub1 cluster network CIDR).
- Check the logs back in the Nginx Pod of the first cluster (aws-sub1):
$ oc config use-context cluster1
Switched to context "cluster1".
$ oc logs -n default -f --tail=5 nginx-6fdb7ffd5b-pk6f7
10.128.2.58 - - [10/Apr/2021:15:15:01 +0000] "GET / HTTP/1.1" 200 612 "-" "curl/7.69.1" "-"
10.128.2.58 - - [10/Apr/2021:15:15:03 +0000] "GET / HTTP/1.1" 200 612 "-" "curl/7.69.1" "-"
10.128.2.58 - - [10/Apr/2021:15:15:04 +0000] "GET / HTTP/1.1" 200 612 "-" "curl/7.69.1" "-"
10.128.2.58 - - [10/Apr/2021:15:17:58 +0000] "HEAD / HTTP/1.1" 200 0 "-" "curl/7.69.1" "-"
10.128.2.58 - - [10/Apr/2021:15:18:29 +0000] "HEAD / HTTP/1.1" 200 0 "-" "curl/7.69.1" "-"
The source IP where the curl originated is THE SAME! Wonderful, isn’t it?
- Finally check with the subctl with the connections are working properly:
$ subctl show connections --kubeconfig=/tmp/test/aws-sub1/aws-sub1-kubeconfig.yaml

Showing information for cluster "aws-sub1":
GATEWAY                         CLUSTER                 REMOTE IP       CABLE DRIVER        SUBNETS                                 STATUS
ip-10-0-31-78                   aws-sub2                10.0.31.78      libreswan           172.30.0.0/16, 10.128.0.0/14            connected
So both clusters are connected with the remote IP (gw node) of 10.0.31.78! The cable protocol used is libreswan, a free software implementation that IPsec and IKE uses.
Deep Dive in the Submariner connectivity between clusters
What’s happened? And why can we reach the nginx service from the second cluster? How does the connection work?
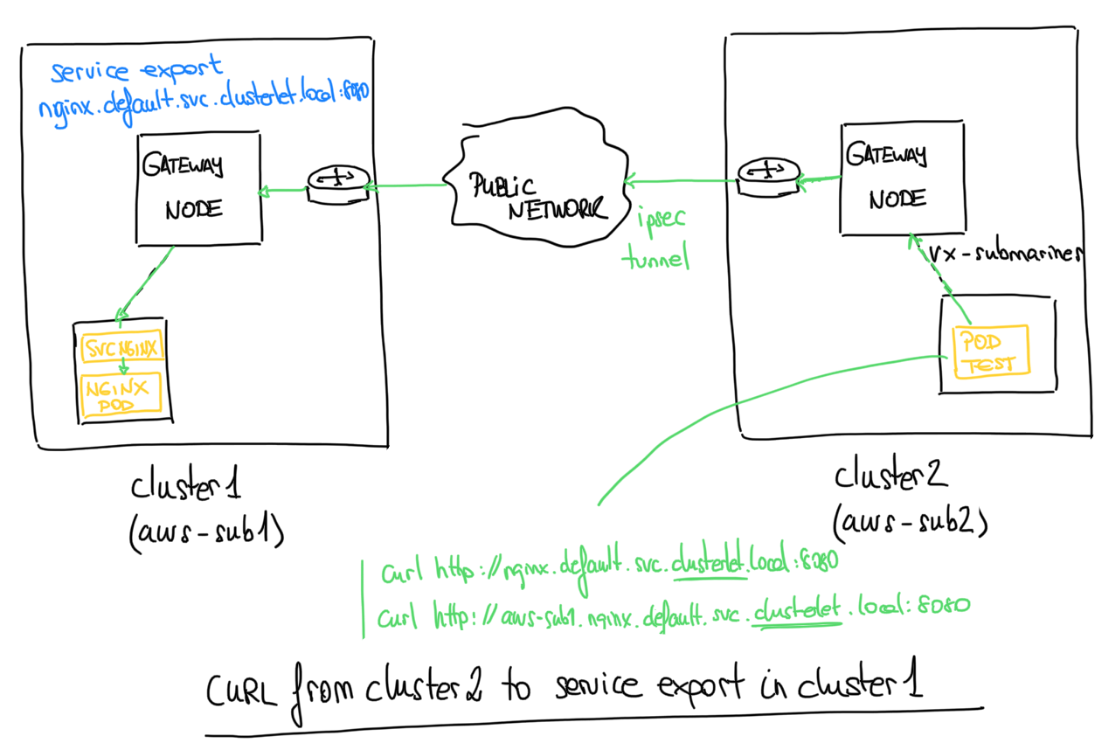
Let’s see the journey when we perform our curl from the cluster2 to the serviceexport of our nginx service:
-
When the source Pod (our submariner-test pod when perform our curl) is on a worker node that is not the elected gateway node, the traffic destined for the remote cluster will transit through the submariner VXLAN tunnel (vx-submariner) to the local cluster gateway node.
-
On the gateway node, traffic is encapsulated in an IPsec tunnel and forwarded to the remote cluster.
-
Once the traffic reaches the destination gateway node, it is routed in one of two ways, depending on the destination CIDR.
-
If the destination CIDR is a Pod network, the traffic is routed via CNI-programmed network (openshift sdn with Openvswitch in our case).
-
If the destination CIDR is a Service network, then traffic is routed through the facility configured via kube-proxy on the destination gateway node.
Deploy an Stateful Application and connect within different clusters with Submariner
Now that we know that our submariner connectivities and tunnels work properly, and we understand a bit more about what’s happening behind the hood, let’s do our real business: connecting different microservices of our application spanned across different clusters. Cool, right?
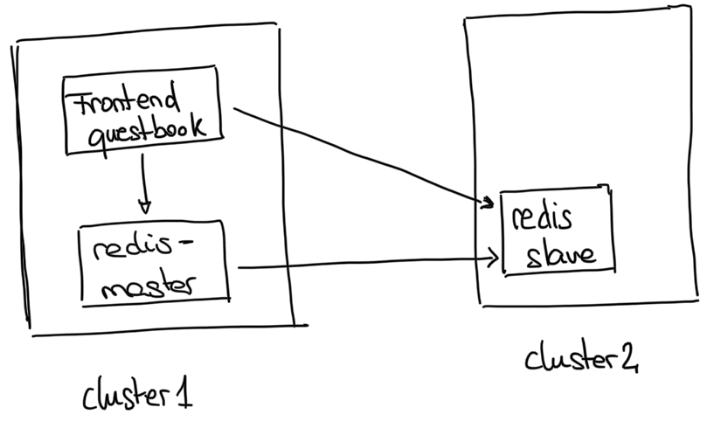
We will deploy a FrontEnd and a Redis with a master-slave replication:
The frontend will be deployed in the cluster1 with the Redis master and the and Redis slave in cluster2. Redis Master will replicate into the redis-slave using the serviceexport of the redis-slave.
The frontend (GuestBook app), will connect as well to the ServiceExports of the Redis Master and Redis Slave for store and consume the data for our app.
The application and all of the elements are available in the public repo for this demo.
NOTE: this app was forked from the original repo adding GitOps for the provision using RHACM.
Deployment of the Application in Multiclustering - GitOps and RHACM
We can deploy our app by hand, correct? But this is not using the full potential of ACM. Let’s do GitOps!
The repository of our app is divided in 3 main folders for each microservice of our app: guestbook-app, redis-master-app and redis-slave-app.
Inside of each repository, we have 2 main folders:
- acm-resources: the files for do the GitOps deployment through ACM
-
-app: the specific files for our microservice (deployment, service, routes, namespaces, etc).
For more information about the GitOps and RHACM check a fantastic blog post of my pal Mario Vazquez.
So now, let’s deploy our apps using RHACM and GitOps:
- Deploy the GuestBook App in cluster Managed 1
$ oc config use-context hubcluster
Switched to context "hubcluster".
$ oc apply -k guestbook-app/acm-resources
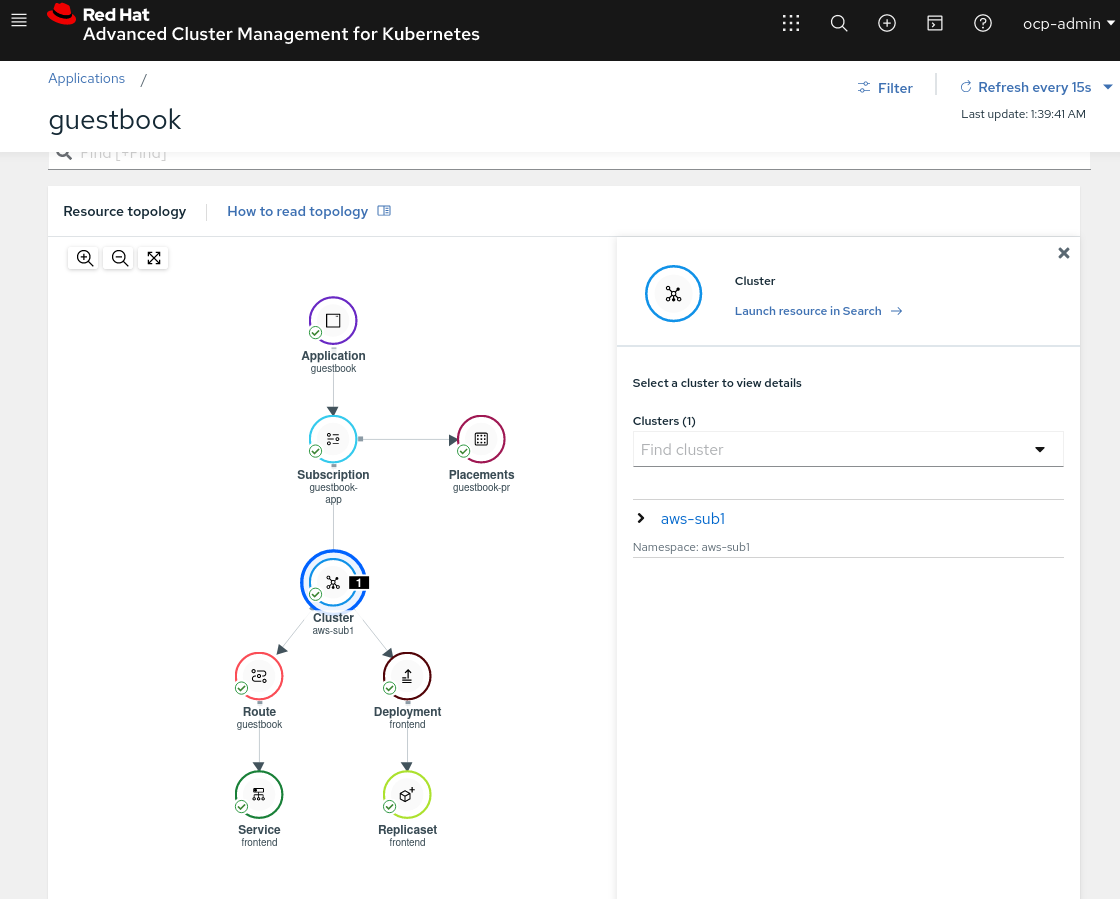
As we can see the guestbook microservice is deployed into the cluster1 because of the placementrules.
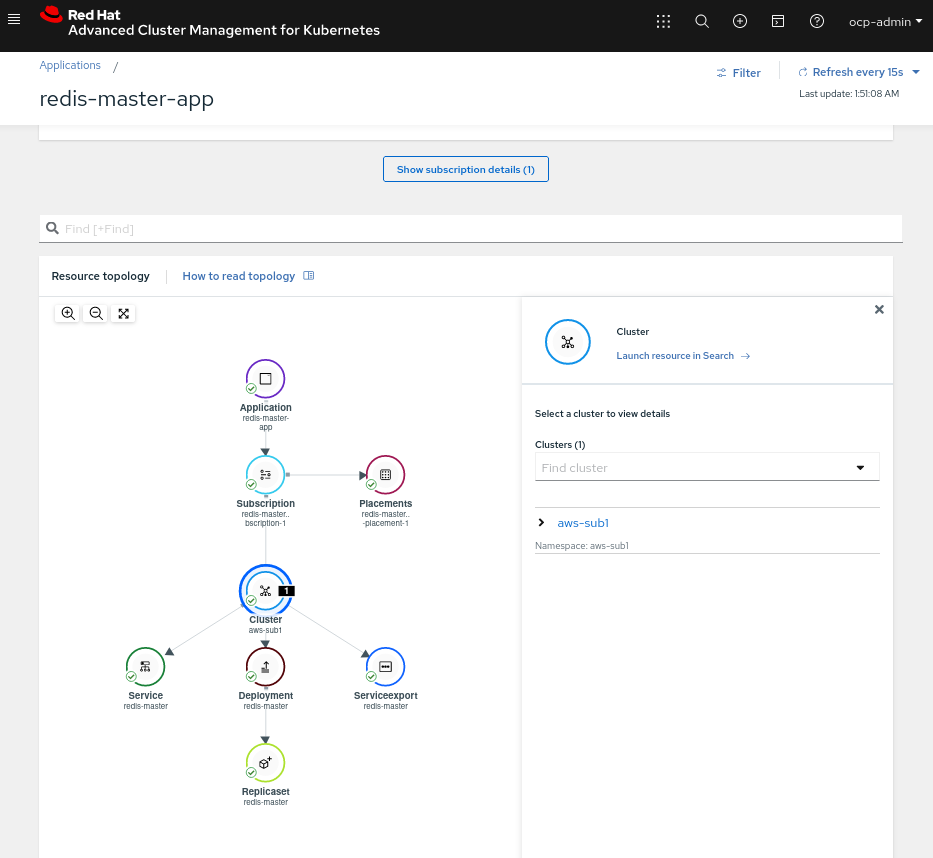
- Deploy the Redis Master App in Cluster Managed 1
$ oc apply -k redis-master-app/acm-resources
As we can see the redis-master microservice is deployed into the cluster1 because of the placementrules.
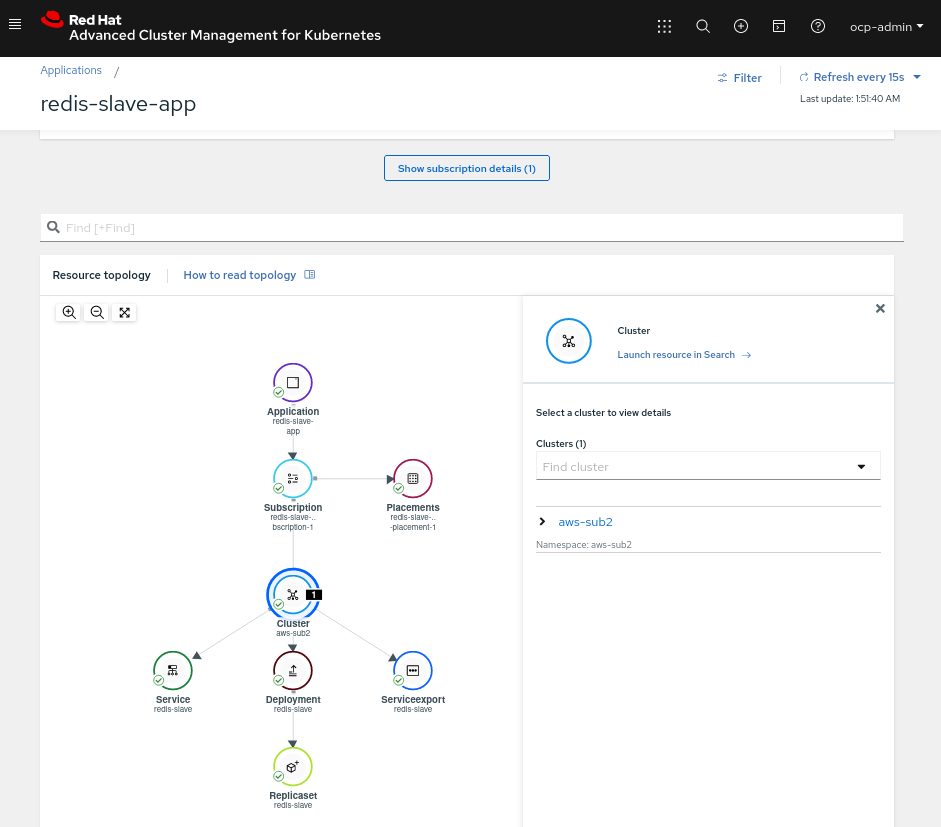
- Deploy the Redis Slave App in Cluster Managed 2
$ oc apply -k redis-slave-app/acm-resources
As we can see the redis-slave microservice is deployed into the cluster2 because of the placementrules.
- We need to do a final tweak into the guestbook namespace in both managed clusters and allow our apps to run as anyuid temporally:
$ oc config use-context cluster1
Switched to context "cluster1".

$ oc adm policy add-scc-to-user anyuid -z default -n guestbook
clusterrole.rbac.authorization.k8s.io/system:openshift:scc:anyuid added: "default"

$ oc delete pod --all -n guestbook
$ oc config use-context cluster2
Switched to context "cluster2".

$ oc adm policy add-scc-to-user anyuid -z default -n guestbook
clusterrole.rbac.authorization.k8s.io/system:openshift:scc:anyuid added: "default"

$ oc delete pod --all -n guestbook
NOTE: this is only for a PoC and for demo. In production envs you need to adjust the UIDs, and not run pods as root as much as possible.
Using the ServiceExport to communicate between the multiclustering overlay networks
The guestbook frontend connects to the redis-master and redis-slave microservices using the ServiceExport from the redis-master and the redis-slave defines envs in their deployment:
- name: REDIS_MASTER_SERVICE_HOST
  value: redis-master.guestbook.svc.clusterset.local
- name: REDIS_SLAVE_SERVICE_HOST
  value: redis-slave.guestbook.svc.clusterset.local
And on the other hand the Redis-Slave uses the following envs in their deployment:
- name: REDIS_MASTER_SERVICE_HOST
  value: redis-master.guestbook.svc.clusterset.local
- Check the Redis Master logs to see if the Master-Slave communication is working properly:
$ oc config use-context cluster1

$ REDIS_POD=$(oc get pod -n guestbook | grep redis | awk '{ print $1 }')
$ oc logs --tail=4 -f $REDIS_POD
[1] 10 Apr 23:54:38.534 * Waiting for end of BGSAVE for SYNC
[1] 10 Apr 23:54:38.565 * Background saving terminated with success
[1] 10 Apr 23:54:38.565 * Synchronization with slave 10.129.3.20:6379 succeeded
[1] 10 Apr 23:54:38.565 * Synchronization with slave 10.128.2.80:6379 succeeded
The pods of the Redis-Master shows that the slave is synching properly with the master going through the IPsec tunnels of the Submariner from Cluster2 to Cluster1 and viceversa.
- Change to the cluster2 (aws-sub2) and see the logs of the Redis-Slave:
$ oc get pod -n guestbook
NAME                           READY   STATUS    RESTARTS   AGE
redis-slave-7976dcf88d-dfjjj   1/1     Running   0          11m
redis-slave-7976dcf88d-knb7v   1/1     Running   0          11m
Testing the Synchronization of the Redis Master-Slave between clusters and interacting with our FrontEnd
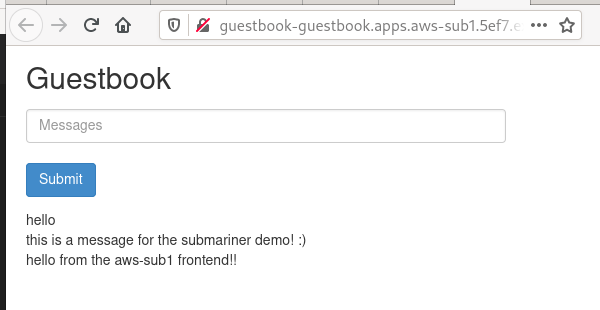
To test the sync between the data from the Redis Master<->Slave, let’s write some data into our frontend. Access to the route of the guestbook, from the ACM y write some data:
- Now let’s see the logs:
$ oc logs --tail=10 -f redis-slave-7976dcf88d-dzcvg -n guestbook
8:S 11 Apr 00:00:37.550 * Connecting to MASTER redis-master.guestbook.svc.clusterset.local:6379
8:S 11 Apr 00:00:37.557 * MASTER <-> SLAVE sync started
8:S 11 Apr 00:00:37.559 * Non blocking connect for SYNC fired the event.
8:S 11 Apr 00:00:37.560 * Master replied to PING, replication can continue...
8:S 11 Apr 00:00:37.561 * Partial resynchronization not possible (no cached master)
8:S 11 Apr 00:00:37.562 * Full resync from master: 88b75d3527d38d769aabb4aa1f5d8bf85e9feb16:1236
8:S 11 Apr 00:00:37.592 * MASTER <-> SLAVE sync: receiving 83 bytes from master
8:S 11 Apr 00:00:37.592 * MASTER <-> SLAVE sync: Flushing old data
8:S 11 Apr 00:00:37.592 * MASTER <-> SLAVE sync: Loading DB in memory
8:S 11 Apr 00:00:37.592 * MASTER <-> SLAVE sync: Finished with success
The sync is automatic and almost instanteneous between Master-Slave.
- We can check the data write in the redis-slave with the redis-cli and the following command:
for key in $(redis-cli -p 6379 keys \*);
  do echo "Key : '$key'"
     redis-cli -p 6379 GET $key;
done
- Let’s performed in the redis-slave pod:
$ oc exec -ti -n guestbook redis-slave-7976dcf88d-dzcvg -- bash
root@redis-slave-7976dcf88d-dzcvg:/data# for key in $(redis-cli -p 6379 keys \*);
>   do echo "Key : '$key'"
>      redis-cli -p 6379 GET $key;
> done
Key : 'messages'
",hello,this is a message for the submariner demo! :)"
Alright! Everything that we writed in our guestbook frontend, is there in the Redis-Slave!
- Finally we can add more data and observe if there is also synched:
root@redis-slave-7976dcf88d-dzcvg:/data# for key in $(redis-cli -p 6379 keys \*);   do echo "Key : '$key'" ;      redis-cli -p 6379 GET $key; done
Key : 'messages'
",hello,this is a message for the submariner demo! :),hello from the aws-sub1 frontend!!"
And that’s how the Redis-Master in the cluster1 sync properly the data to the redis-slave in the cluster2.
Thanks for reading and hope that you enjoyed the blog post as much as I did writing it.
NOTE: Opinions expressed in this blog are my own and do not necessarily reflect that of the company I work for.
Stay tuned and happy submarining!
