Monitoring and analysis of Network Flow Traffic in OpenShift (Part II)
How can you monitor and analyse the network flow records of OpenShift in a graphical way and execute search queries for specific values? And how to have some dashboards in order to expose this information for your SREs or team members?
This is the second blog post about Monitor and analysis of Network Flow Traffic in OpenShift and it’s based in the Monitoring Network Flow Traffic in OpenShift blog post. So if you didn’t check it, go ahead and take a look! :)
Overview
Now that we can collect the network flows of our network traffic in the OpenShift clusters using OVN Kubernetes CNI plugin our job is done right? But if you have checked the last blog post, the amount of network flows collected is massive, and without the proper categorization it is hard to search for anything valuable without using greps in each flow and deep dive a lot in every record collected.
But is this the only way to do it?
How about collecting the network flows and aggregating them in a central point to visualize after and create dashboards in order to expose and consume the information in a nicer way? And if we use a stack that is well known in OpenShift like the Elastic Stack?
- Elasticsearch - We will use ES as our network flow store, that will be where the flow records in sFlow format will be stored.
- Kibana - this will be our UI component that we can use to view the flow records, graphs, dashboards, etc.
- Logstash - Logstash dynamically ingests, transforms, and ships your data regardless of format or complexity. We will use a specific implementation of Logstash called ElastiFlow
You can use the ECK Operator, as a very nice OpenShift article describes.
In this specific case, for quick tweaks that we needed to address, I prepared a github repository with all the pieces needed for this blog post.
Installing the ELK and the ElastiFlow in OpenShift 4
- Clone the repository:
git clone https://github.com/rcarrata/ocp4-netflow.git
- Deploy ELK with the kustomization using oc command:
oc apply -k elastiflow/overlay
- Assign privileged scc to the SA of elastiflow
oc adm policy add-scc-to-user privileged -z default -n elastiflow
this is needed because ES and Elastiflow need some capabilities that are restricted by default in OpenShift.
NOTE: this is NOT recommended for a productive environment, nor other critical environments. It’s just a PoC, so please DON’T do it in prod/pre environments. Use the proper SAs with the proper rbac :)
- Check the resources created in the namespace
$ oc get pod -n efk
NAME                          READY   STATUS    RESTARTS   AGE
elasticsearch-0               1/1     Running   0          1h
elastiflow-75cfd94848-btqjl   1/1     Running   0          1h
kibana-658885cf88-wp54g       1/1     Running   0          1h
we are using in this PoC the following versions:
- ES - 7.0.1
- ElastiFlow - 3.5.0
-
Kibana - 7.0.1
- Check the Route and the Services:
oc get svc,route -n efk
NAME                    TYPE           CLUSTER-IP       EXTERNAL-IP   PORT(S)          AGE
service/elasticsearch   ClusterIP      172.30.167.126   <none>        9200/TCP         25h
service/kibana          ClusterIP      172.30.152.42    <none>        5601/TCP         25h
service/logstash        LoadBalancer   172.30.11.107    <pending>     6343:30391/UDP   25h

NAME                                     HOST/PORT                                  PATH   SERVICES   PORT   TERMINATION     WILDCARD
route.route.openshift.io/kibana-secure   kibana-elastiflow.apps.xxx.xxx.com          kibana     5601   edge/Redirect   None
NOTE: Red Hat NOT offers support of ANY kind to ElastiFlow or any associations, so please be aware of that.
Configure the ElastiFlow dashboards in Kibana
Access the route of the Kibana dashboard in the ns elastiflow:
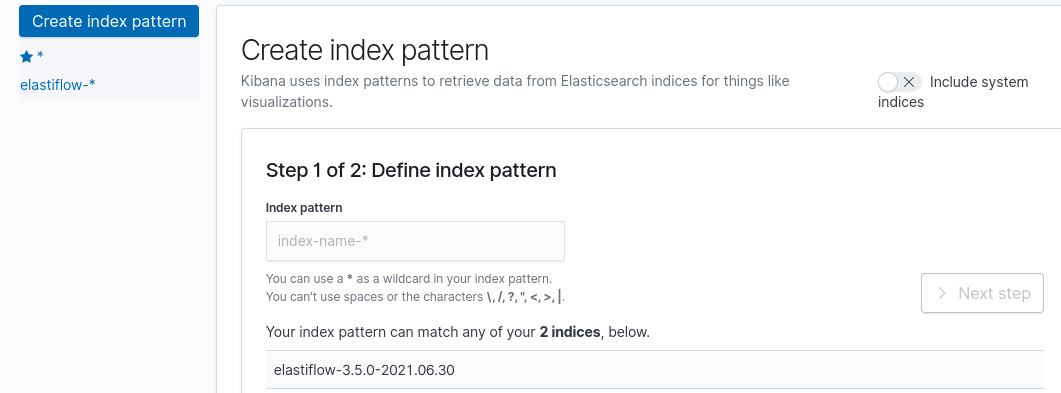
Once the page loads, go to Management -> Index Patterns -> Create Index Pattern. Just pop a star/wildcard in the box and hit next step until done like so:
Now we need to import some dashboards, which is one of the things I really like about this project is that it has a nice collection ready for import.
We will use one of the dashboard templates created originally in the elastiflow repository. We will use an specific version matching to our elastiflow version, located in our example repository.
Go to Management -> Saved Objects -> Import saved objects and upload the “elastiflow.kibana.7.0.x.json” file.
After waiting a bit, you will receive a lot of very nice dashboards available to check:
Check the Network Flow traffic in Kibana dashboards
Now that we can have the whole ELK and ElastiFlow set up properly and the dashboards properly configured, let’s dig in into the dashboards and in the information exposed!
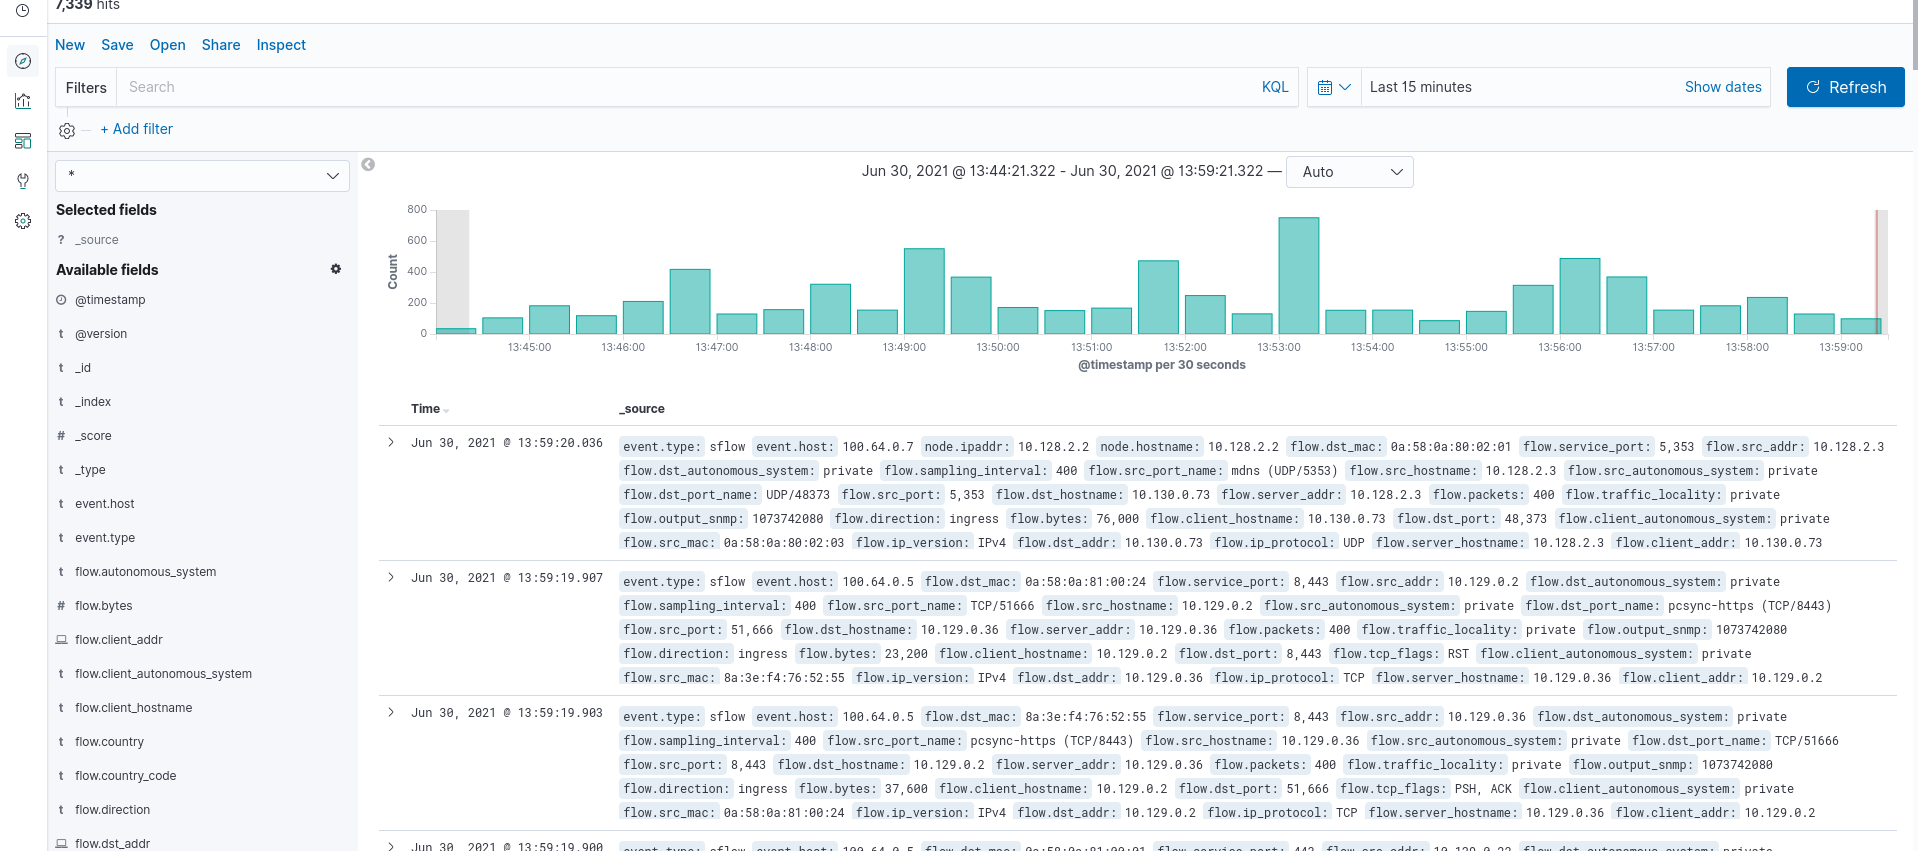
If you go Discover you will see a lot of sFlow flow records of our network traffic collected in ES:
A lot of useful info, isn’t it?
If you go to the Dashboards you will see the dashboards available:
This represents all the servers and clients that originated inside of our OpenShift cluster within the SDN managed by OVN Kubernetes CNI plugin and CNO.
And it can be filtered in a nice way, using Client - Servers filtering by the IPs or even some services like Etcd-Client.
Filtering and obtaining information about our network traffic
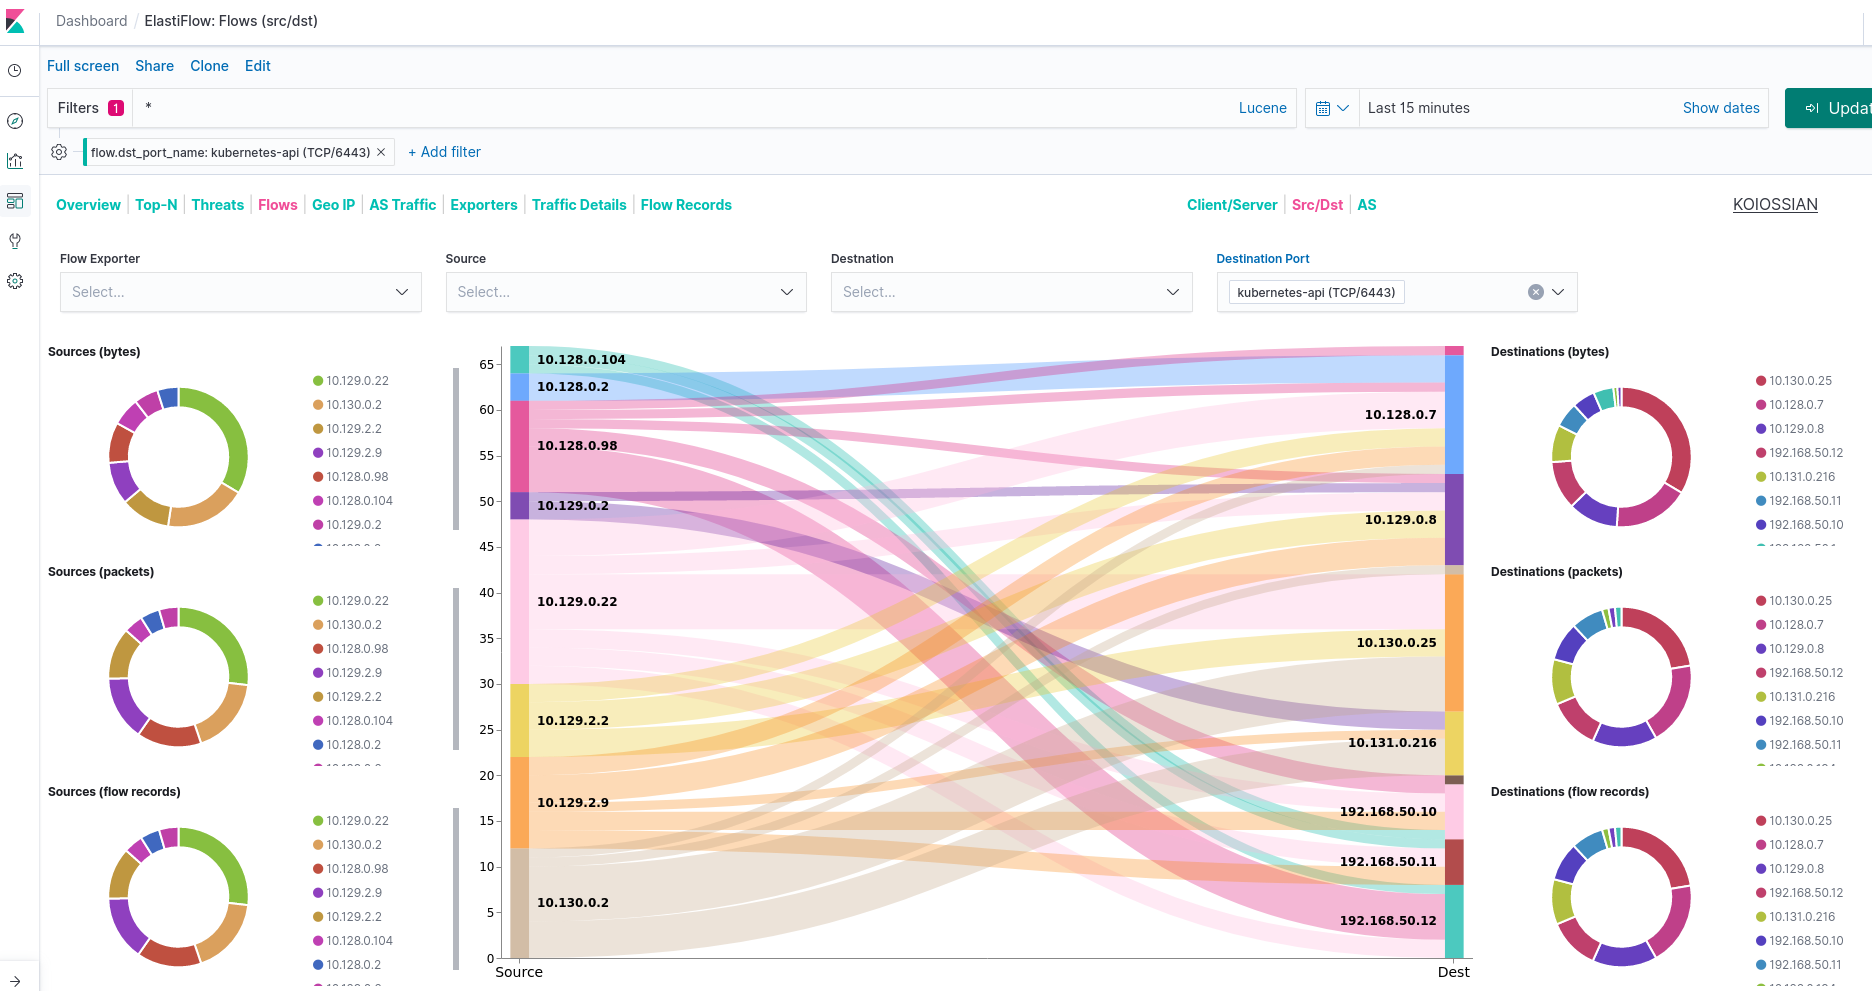
For example if you want to know the Network Flows with the destination of our Kubernetes Api service, you can filtered with the Server tab:
Another example is to use the Traffic Details tab inside of this dashboard to select one of the workloads interested in.
For example, we want to know what’s the traffic originated from the Grafana instance:
$ oc get pod -A -o wide | grep grafana
openshift-monitoring                               grafana-74655dbf66-f6hjg                                          2/2     Running     0          43h     10.128.2.7      compute-0   <none>           <none>
In the Traffic details tab, filter from the source address and select the ClusterIP address from our grafana (10.128.2.7):
As you can see we have 3 clients, one of them is the 10.129.2.9:
oc get pod -A -o wide | grep 10.129.2.9
openshift-monitoring                               prometheus-k8s-0                                                  7/7     Running     1          43h     10.129.2.9      compute-2   <none>           <none>
Our traffic was originated from the Grafana with direction to the Prometheus instance in order to access the metrics stored.
Analysing Flow Records of the etcd clients
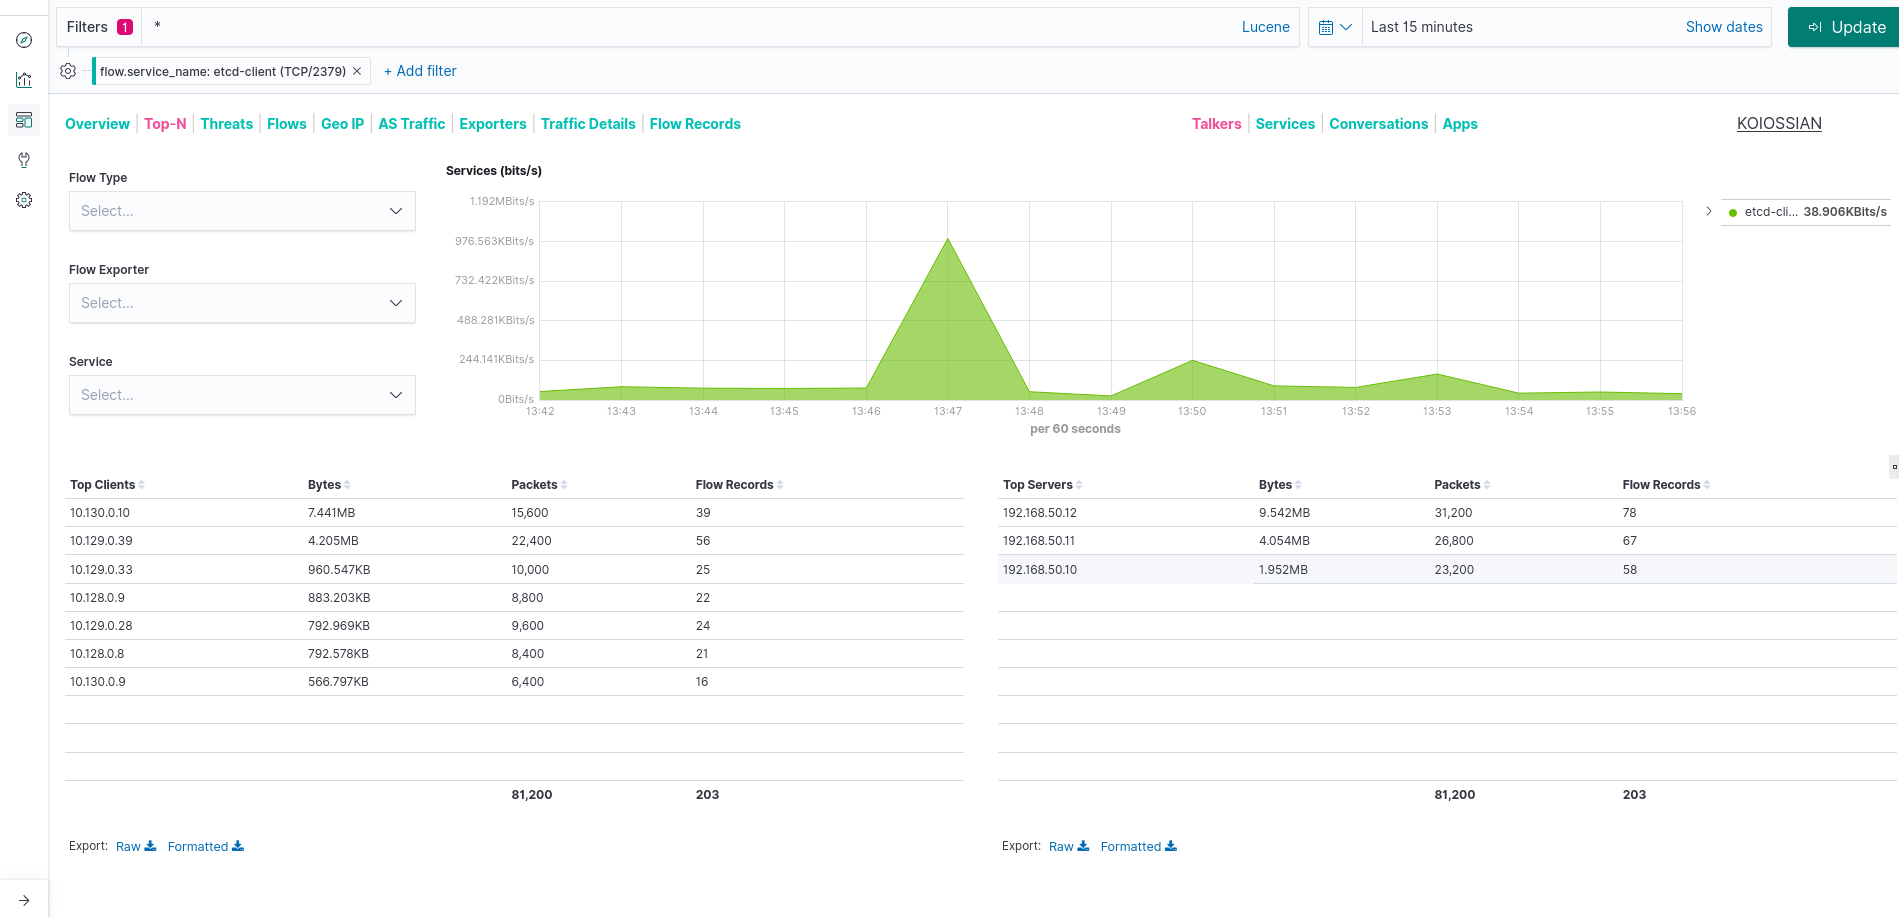
One nice thing of this dashboard, is that allow us to filter also by categories, like for example by service etcd-client.
With that we can extract very useful information that who originated the request, amount of traffic generated, which type of traffic, etc:
If you need more information about one the flow records you can go to the own Flow Records tab in order to check the sFlow records collected from our cluster:
And that’s all about how to monitor and analyse network traffic from OpenShift using Elastic Stack.
Thanks for reading and hope that you enjoyed the blog post as much as I did writing it.
NOTE: Opinions expressed in this blog are my own and do not necessarily reflect that of the company I work for.
Happy NetFlowing!


